
Why it’s getting harder to measure AI performance
The most famous chart in AI might be obsolete soon.
This post originally appeared in Understanding AI.
“There’s no obvious way to compare scores across different benchmarks, which makes it hard to compare model capabilities over long time periods — or to make predictions about future models.”
Before we get to today’s article, I want to recommend some audio content about autonomous vehicles:
Back in 2010, my friend Ryan Avent and I made a bet about the future of autonomous vehicles. The bet came due last month and I won. Ryan and I did a postmortem on my podcast, AI Summer. You can listen here or search for “AI Summer” in your favorite podcast app.
PJ Vogt’s podcast Search Engine just did a two-part series on autonomous vehicles. I’m biased since I was quoted in both episodes, but I thought it was incredibly good. You can listen here, or search for “Search Engine” in your favorite podcast app.
Now for today’s article!
If you’ve followed AI over the last year, you’ve probably seen the famous “METR chart”:
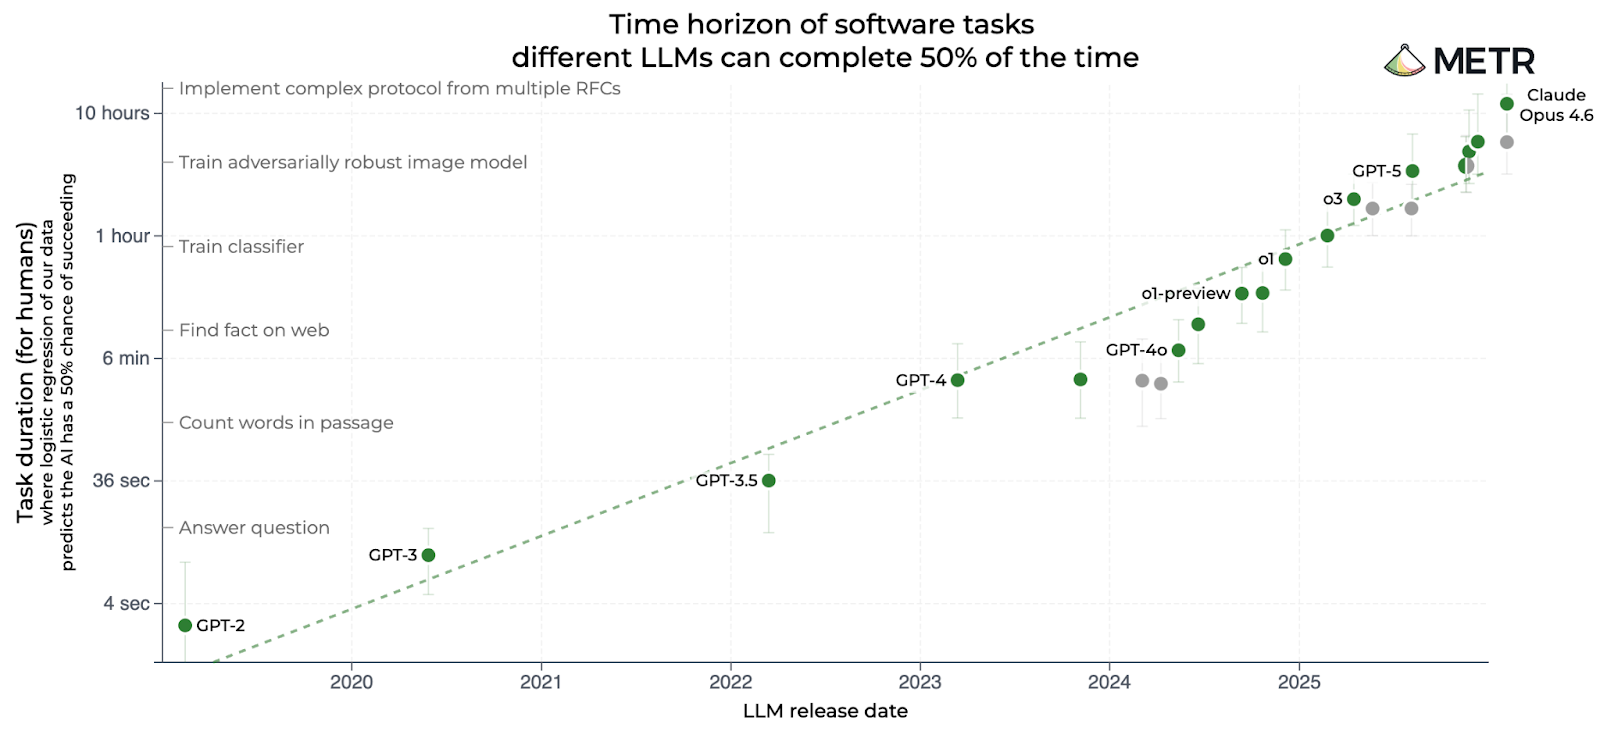
METR, short for Model Evaluation and Threat Research, is based in Berkeley, California. The group has published many charts, but this one has become its calling card. It compares AI models based on the complexity of software engineering tasks they can complete, with complexity measured by how long it takes a human programmer to complete the same task:
GPT-3.5 — the model that powered the original ChatGPT — could complete tasks that took a human programmer about 30 seconds.
GPT-4, released in March 2023, bumped that up to 4 minutes.
o1, released in December 2024, was OpenAI’s first “reasoning model.” It could perform tasks that took a human 40 minutes.
GPT-5, released in August 2025, was able to finish tasks that took humans 3 hours.
Claude Opus 4.6 was released in February by Anthropic. METR estimates it can complete tasks that would take a human programmer 12 hours.
That last figure is twice as long as the estimate for the previous leader, GPT-5.2, which had been released just two months earlier.
I think this chart — and especially the impressive score for Claude Opus 4.6 — has done a lot to foster an impression of accelerating AI progress in recent months. Notice that the chart is logarithmic, so a straight line indicates exponential progress. The fact that Claude Opus 4.6 is above the previous trend line suggests very rapid progress indeed.